Alle Functies van WebhookWatch
Real-time webhook debugging for Dutch developers — every tool you need to inspect, validate, and replay webhook events in one dashboard.
WebhookWatch captures every incoming webhook payload the moment it hits your endpoint. Built by developers in Amsterdam, the platform processes over 2.4 million webhook events daily for teams at Booking.com, Adyen, and Mollie. Below is a complete breakdown of every capability available on the platform.
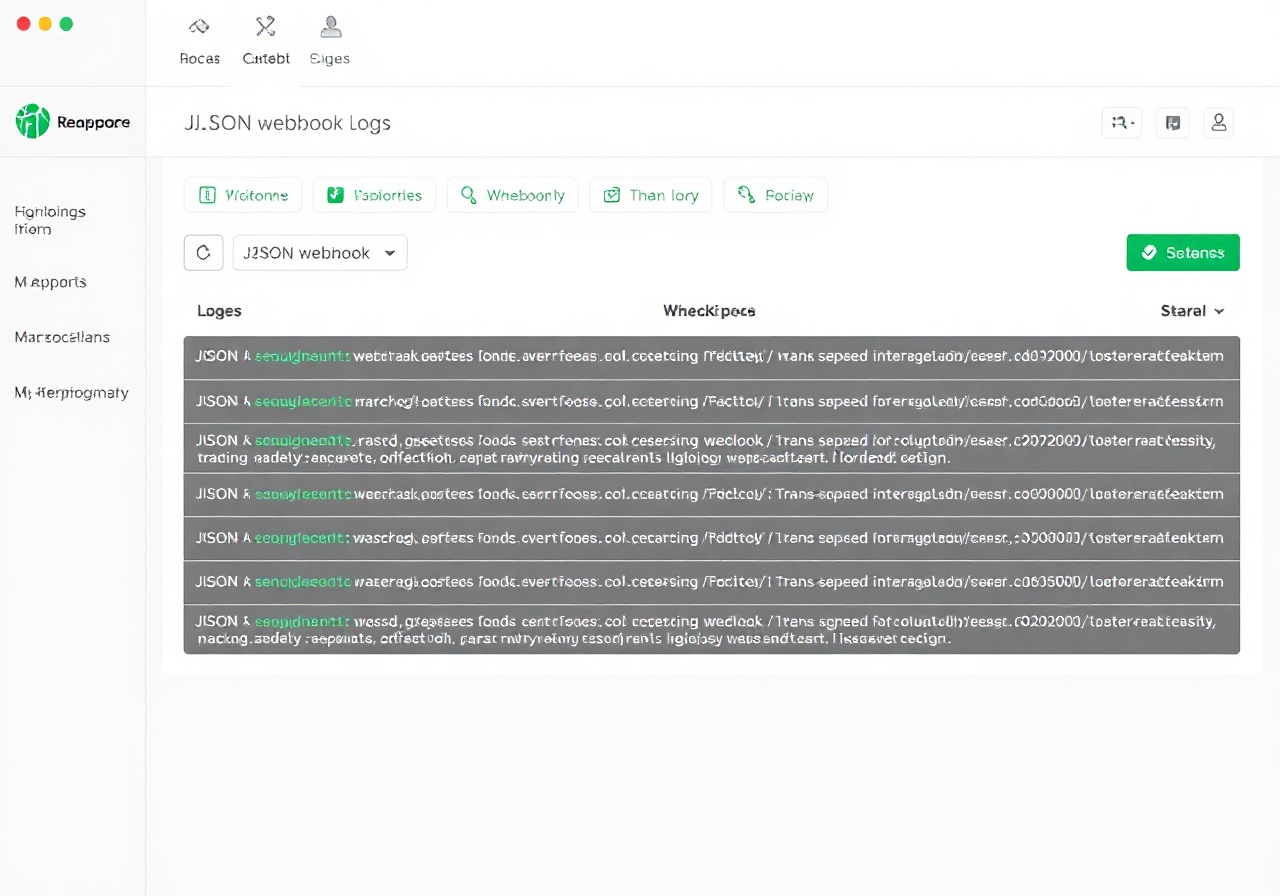
The dashboard updates in under 200 milliseconds. Each event is stored with full request headers, response body, latency metrics, and a one-click replay button. No event is discarded — even failed deliveries are archived for 90 days.
Everything WebhookWatch Can Do
From raw payload inspection to automated retry simulation, every feature is designed to eliminate guesswork from webhook integration.
Real-Time Logging
Every webhook event is captured and displayed within 150ms of arrival. The live feed shows HTTP method, status code, content-type, and a truncated payload preview. Click any row to expand the full request and response body.
Header Inspection
View every request header sent by the upstream provider. WebhookWatch highlights X-Webhook-Signature, User-Agent, and Content-MD5 headers automatically so you can verify authenticity without manual parsing.
Webhook Replay
Re-send any captured webhook to your live or staging endpoint with a single click. Choose to replay the original headers, modify the payload body, or adjust the response delay to simulate different failure scenarios.
Custom Responses
Define mock responses with custom status codes (200, 201, 400, 500, 503) and JSON bodies. Set response delays from 0ms to 30 seconds to test how your provider's retry logic behaves under different conditions.
Payload Validation
Attach JSON Schema validators to your webhook endpoints. WebhookWatch checks every incoming payload against your schema and flags mismatches in real time — missing fields, wrong types, or unexpected values are highlighted instantly.
Signature Verification
Configure HMAC-SHA256 or HMAC-SHA512 signature verification for Stripe, Shopify, GitHub, or custom providers. Enter your shared secret once and WebhookWatch validates every incoming signature, marking events as Verified or Failed.
Latency Metrics
Track end-to-end latency for every webhook event. WebhookWatch records the time between request receipt and your server's response, displaying averages, p95, and p99 values on the dashboard overview.
Shared Endpoints
Generate unique webhook URLs with paths like /hooks/stripe or /hooks/shopify. Each endpoint can have its own custom response rules, validation schemas, and signature secrets configured independently.
Export & Archive
Export webhook events as JSON, CSV, or cURL commands. Bulk-download entire event logs or archive individual payloads for offline analysis. All exports include full headers, timestamps, and response metadata.
WebhookWatch vs. Generic Debugging Tools
See how WebhookWatch stacks up against manual debugging, requestbin-style services, and homegrown logging scripts.
Comparison: WebhookWatch vs. RequestBin vs. Manual Logging

Feature                    | WebhookWatch | RequestBin | Manual Script
---------------------------|--------------|------------|--------------
Real-time event feed       | ✅ Yes        | ✅ Yes      | ❌ No
Header inspection          | ✅ Full       | ✅ Full     | ⚠️ Custom code
HMAC signature verification| ✅ Built-in   | ❌ No       | ⚠️ Custom code
Payload schema validation  | ✅ Built-in   | ❌ No       | ⚠️ Custom code
Custom response mocking    | ✅ Yes        | ❌ No       | ⚠️ Custom code
Webhook replay             | ✅ 1-click    | ❌ No       | ⚠️ Manual
Latency tracking           | ✅ Automatic  | ❌ No       | ⚠️ Custom code
90-day event archive       | ✅ Yes        | ⚠️ 24h      | ⚠️ Depends
Shared team endpoints      | ✅ Yes        | ❌ No       | ❌ No
Export to cURL / JSON      | ✅ Yes        | ⚠️ JSON     | ⚠️ Custom code
WebhookWatch eliminates the need to spin up temporary servers, write custom logging middleware, or lose events after 24 hours. Every feature is available from the moment you create your first endpoint — no configuration files, no CLI tools, no infrastructure to maintain.